Building interactive infographics right in the browser without code
6-2-2018
For Dialogic, I developed an interactive environment for the creation of web-based infographics and other interactive experiences right in the browser. The environment is used in the Dialogic Platform for providing rich dashboard experiences to customers. The component is also used on diasli.de, which is a service where you can create and share infographic slides.
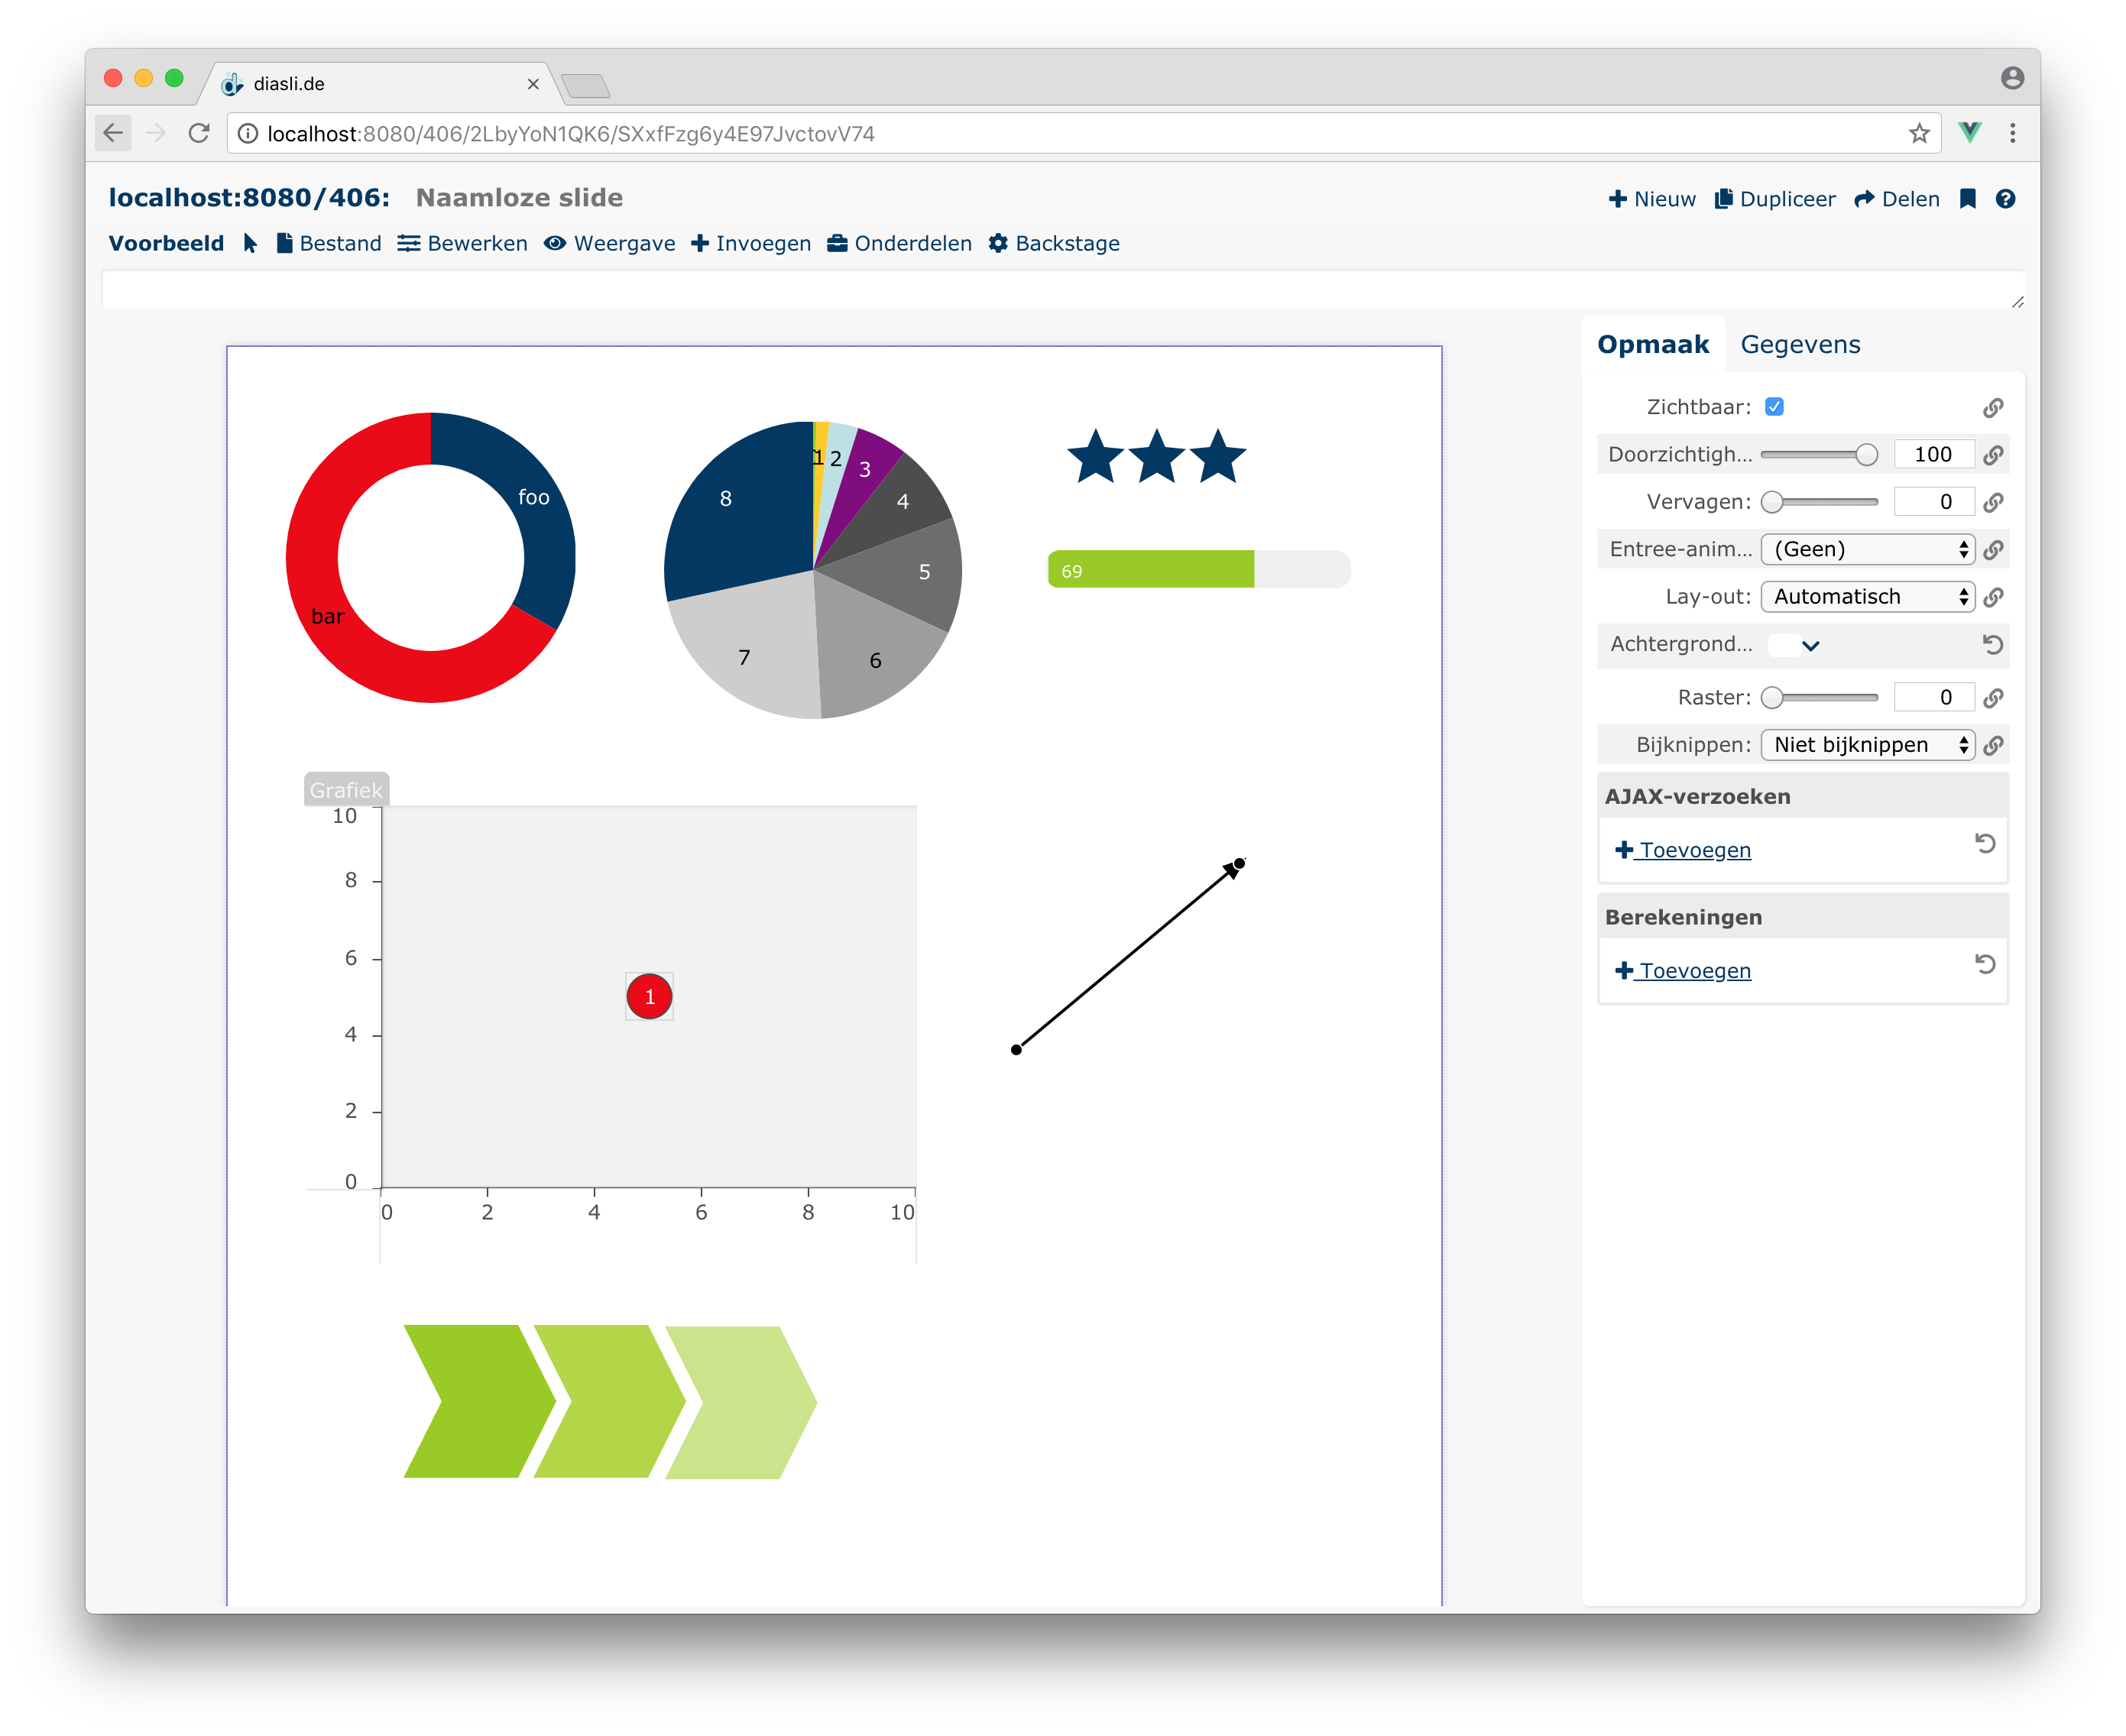
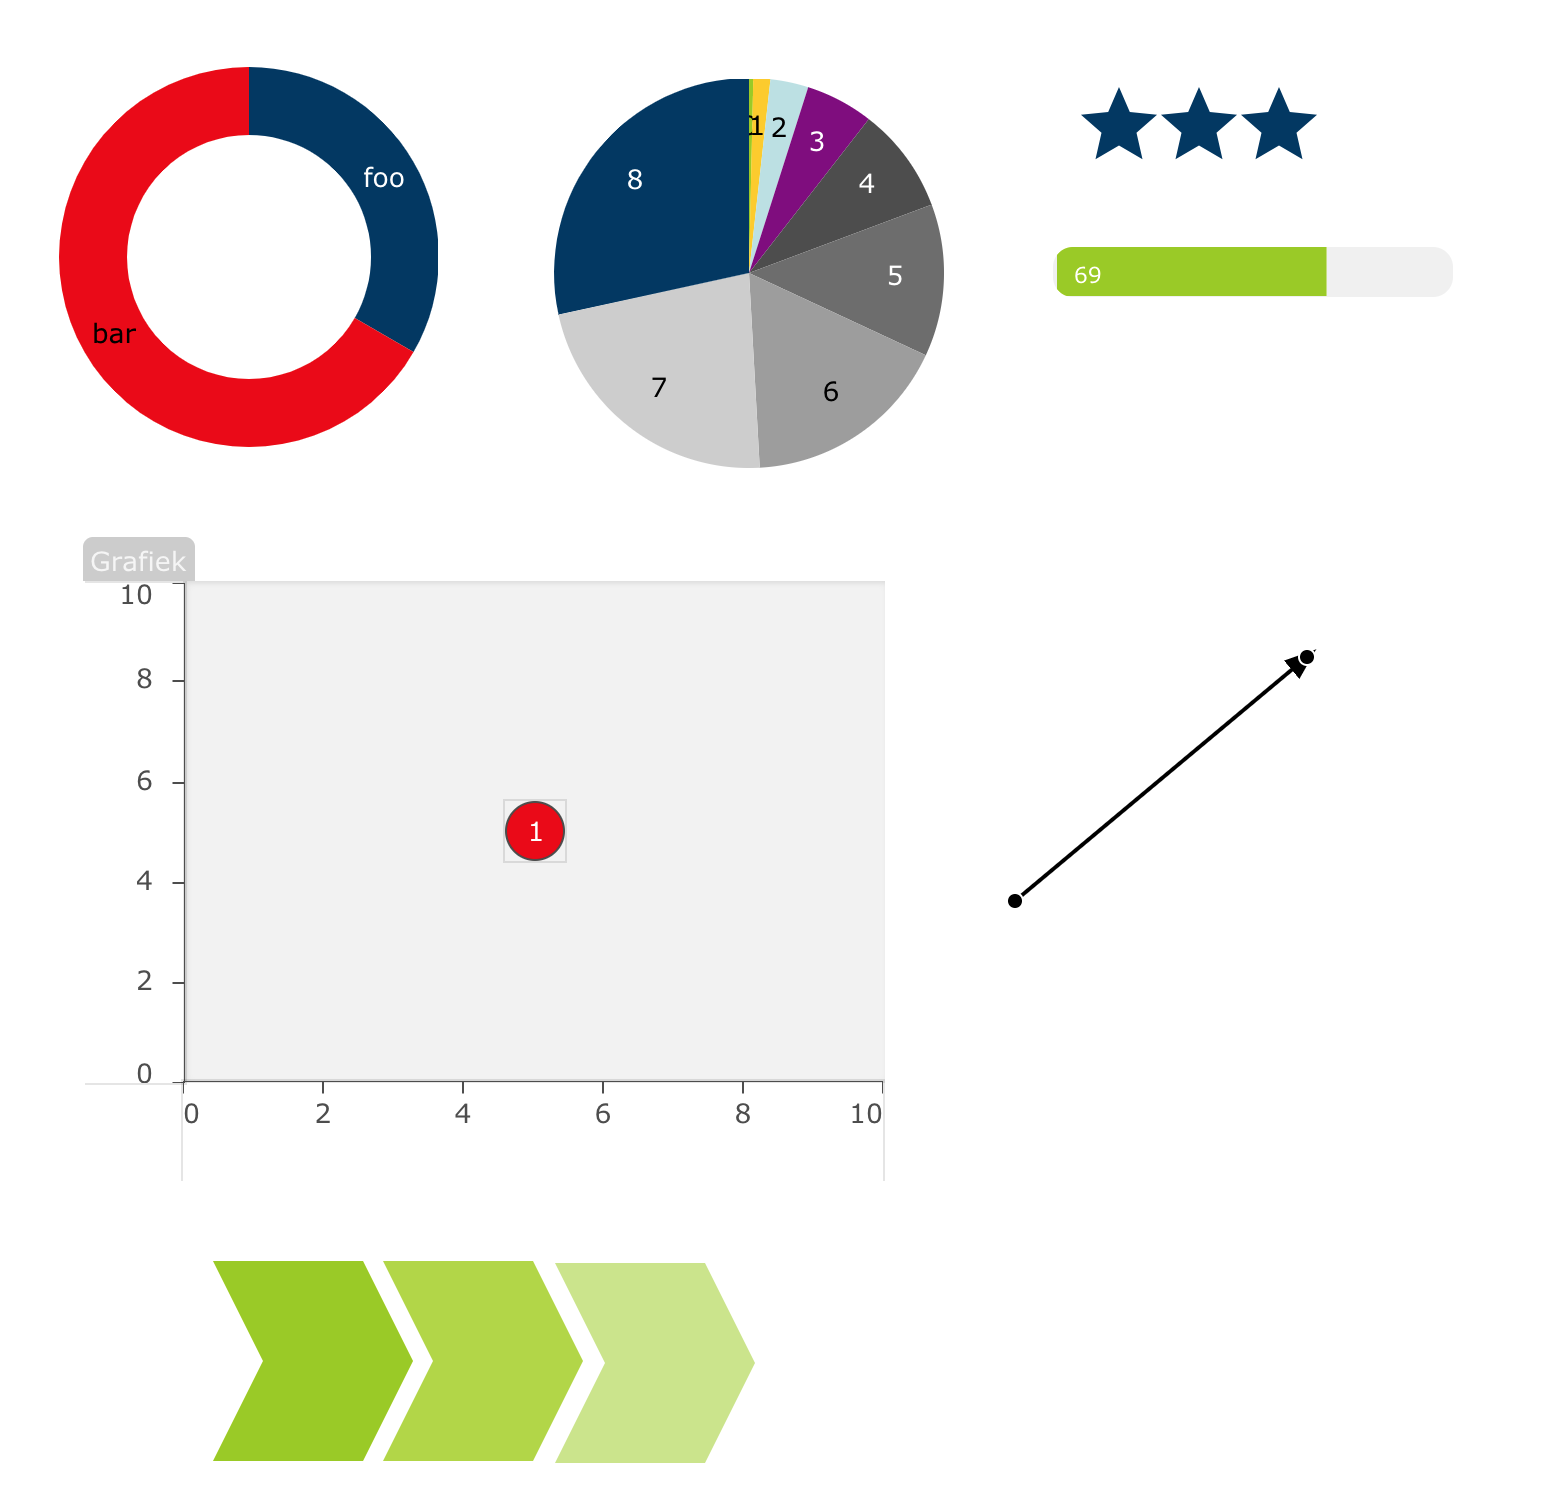
To make an infographic, you can simply drag and drop components on a ‘slide’, like you would do in PowerPoint. The crucial difference with PowerPoint is that each element can be bound to data, which lives along side the document, and can even be loaded dynamically (e.g. using an API). Additionally, all properties of a component can be bound to data. Whenever the data changes, all bound components are updated immediately. This means that if both a slider and the ‘fill color’ of a circle shape are bound to a single value, the fill color will update while dragging the slider. It is also possible to bind using formulas, meaning that the fill color can change quadratically or between multiple colors as the value changes.
Special components can be used to generate content dynamically. Using for instance the ‘repeater’ component creates a copy of a template component for each row in a data set. This allows for dynamic lists and tables, which can (again) be filtered by using the repeater with a formula. Repeaters also support reordering and may contain components that change the source data, allowing for very easy creation of highly complex data editing grids.
Technically, the editor and runtime are built around Vue.js. Both the design of an infographic as well as the attached data are reactively bound to by each component. The system includes a formula parser as well. On diasli.de, the client connects through WebSocket to a NodeJS-based server, which provides the design and data as JSON object. When editing, a client can send updates to this server als JSONPatches to the original design. The server validates each design using a JSON Schema. Other clients will receive the patches and can update their design accordingly, which allows for collaborative editing and viewing. The server uses Redis (its publish-subscribe functionality in particular) for storage.
You can try out the editor yourself by going to diasli.de. Some demos to get started (click ‘duplicate’ to create your own copy and experiment):